

A crypto portfolio grows through many decisions that take place across different moments of the market. One week brings a quiet pullback. Another week brings a sudden burst of activity.
Across these shifts, entries accumulate and the original cost of a position becomes harder to recall. This is where the average buy price brings order into the picture.
It represents the blended cost of your position and keeps the entire portfolio grounded in one clear number. Once that number is known, every part of your decision making becomes steadier because the cost base is not spread across scattered memories.
You get a more structured view of your coins when you understand the blended price. The market may rise sharply at times and fall just as quickly, but your position is easier to read because the average buy tells you where the base of your investment truly sits.
You can compare the market with your blended cost at any moment and understand the direction of your portfolio without relying on guesswork.
What Average Buy Price Means
The average buy price shows how much money went into a coin compared with how much quantity came out of those purchases. It combines all entries into one figure, which is why the blended price is such a reliable marker for long term tracking. The formula stays the same for all assets.
Average Buy Price = Total Investment divided by Total Quantity
If you built a position slowly, the blended price reveals the real cost behind those entries. If you built the position quickly, the number reflects that flow as well. Smaller entries have a soft influence on the total.
Larger entries move the blended price more sharply. This structure mirrors the real behavior of the market and the real behavior of traders, which is why exchanges and tax records all follow this method.
You can check your numbers on our website Cryptocalculate.net, because this Crypto profit calculator gives you a clear view of your trades in just a few steps.
Weighted Average vs Simple Average
This part matters because many traders confuse the two.
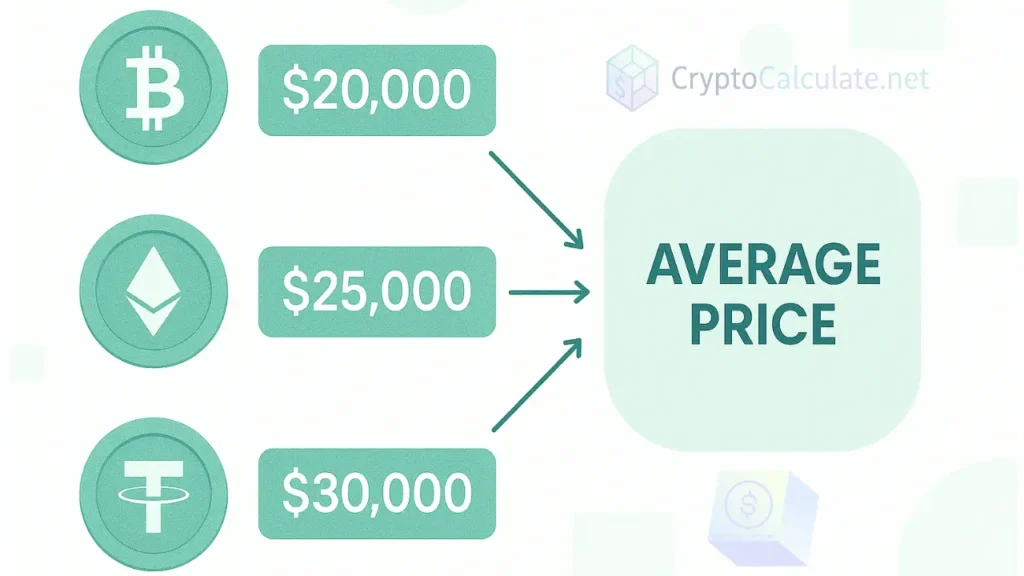
A simple average is the arithmetic mean of prices. If you bought at 20000, 30000, and 25000, your simple average would be the sum divided by three. Crypto trading does not follow that.
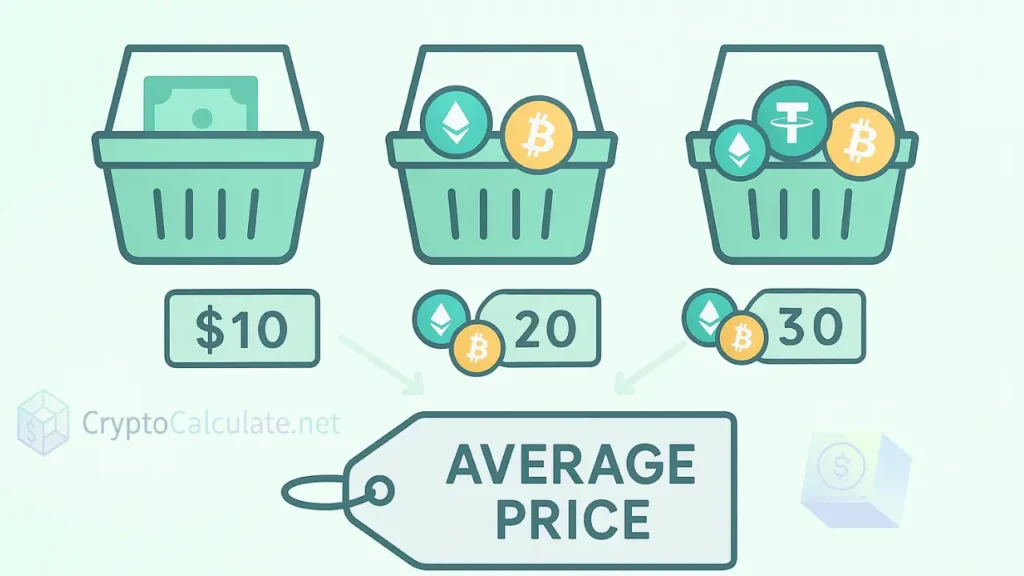
A weighted average gives each entry the correct weight based on how much money you spent. A 100 dollar buy at 20000 does not carry the same importance as a 2000 dollar buy at 30000. Weighted average buy price reflects the real financial impact of each entry, and that is why exchanges and tax systems rely on it.
You always use weighted average in crypto portfolios.
Basic Example of Average Buy Price
Imagine you buy 0.05 BTC at 20000 dollars. That is a 1000 dollar entry. Later you buy another 0.05 BTC at 30000 dollars. That costs 1500 dollars.
- Your total spend is 2500 dollars.
- Your total quantity is 0.10 BTC.
- Your average buy price becomes 25000 dollars.
The moment the market crosses 25000, your position enters positive territory.
Why Average Buy Price Matters
You get a cleaner view of your portfolio when this number is present. You can read trends with more clarity because the blended cost does not react to every candle. You have a structured base that supports decisions about entries, exits, and recalculations. You also gain a stronger sense of direction because the number removes emotional pressure from short term market noise.
A steady cost base reduces confusion. It also gives you more confidence when you review your overall position during moments of volatility.
How to Calculate Average Buy Price Step by Step
Step 1: List All Buy Entries
Start with a list that includes quantity and price. This list becomes the foundation of the calculation. Imagine a series of Ethereum entries. One buy is 2 ETH at 1600 dollars. Another is 3 ETH at 1800 dollars. A third is 1 ETH at 2000 dollars.
Step 2: Calculate Total Investment
Multiply each quantity by its price.
- 2 ETH at 1600 dollars becomes 3200 dollars
- 3 ETH at 1800 dollars becomes 5400 dollars
- 1 ETH at 2000 dollars becomes 2000 dollars
The total investment reaches 10600 dollars.
Step 3: Calculate Total Quantity
You add your quantities.
2+ 3 + 1 = 6 ETH.
Step 4: Divide Total Spend by Total Quantity
10600 divided by 6 gives a blended price of 1766 dollars. That number becomes the anchor for your Ethereum position.
How the Average Forms Across Several Entries
| Coin | Quantity | Price | Total Spent | Final Average Buy |
|---|---|---|---|---|
| BTC | 0.05 | 20000 | 1000 | 25000 |
| BTC | 0.05 | 30000 | 1500 | |
| ETH | 2 | 1600 | 3200 | 1766 |
| ETH | 3 | 1800 | 5400 | |
| ETH | 1 | 2000 | 2000 |
This pattern remains the same across any coin. The blended result always reflects the weight of the investment.
The Influence of Fees
Exchange fees and network fees raise the actual cost of each entry. Even small charges stack over time and push the blended cost higher. These charges must be added to the total investment before the blended calculation takes place. Many traders discover that their average buy is higher than expected once fees are included. This adjustment strengthens your understanding of the real cost of your portfolio.
How Exchanges Calculate It
Different exchanges follow slightly different methods.
- Binance uses a weighted average model inside the portfolio summary.
- Coinbase shows average cost per lot and adjusts when you add new entries.
- Kraken follows a cost basis model that aligns with tax rules.
- WazirX does not show average buy directly. You need to calculate it on your own.
When you understand how these systems work, you track your numbers more confidently.
Tracking Your Average Buy Automatically
Portfolio Apps
Apps handle the math automatically when you trade frequently.
- CoinStats updates average cost inside your portfolio card.
- Delta recalculates average buy whenever you add new entries.
- Binance and Coinbase show average position cost inside your asset summary.
You can export backups regularly to avoid data loss.
Using Google Sheets
You can create a basic sheet and add columns for quantity, price, fee, and total spend. Once you sum these values and divide them, your average buy appears instantly. Sheets help you customize the layout for several assets.
Average Buy Price in Dollar Cost Averaging
The blended cost shows the core price of your position. Break even includes fees, taxes, and other expenses. Break even usually sits above the blended buy. You can use the blended buy to judge your current standing, and the break even level to determine the point where your entire cost structure turns positive.
Average Buy Price After Partial Sells
This part confuses many traders.
Partial sells do not change your average buy price. The quantity changes, but the weighted cost per coin stays the same. Only your remaining total cost basis changes.
For example, if you bought 1 ETH at 2000 dollars and sold 0.5 ETH later, your average buy remains 2000 dollars. Your remaining cost basis becomes 1000 dollars. You should track this carefully for taxes.
Advanced Portfolio Situations
Buying Through Crypto Pairs
If you buy using BTC, ETH, or stablecoins, you need to convert each entry into one reference currency before calculating the average. Some traders store buys in USDT, some in USD, and some in fiat. You need one unified currency for the math to work.
Staking Rewards
If you add staking rewards into your main quantity, your average may appear lower. If you keep them separate, your calculation stays clean. There is no right or wrong approach. You only need consistency.
Yield Farming and Reinvesting
If you reinvest rewards into the same asset, your quantity increases. This changes the average buy. You need a fresh calculation each time.
Difference Between Average Buy and Break Even Price
Average buy is your position cost. Break even includes taxes, fees, and related charges. If your average buy is 25000 and you spent 200 dollars in fees, your break even will be above 25000. You can use average buy to check your status and use break even to decide your protection level.
Futures Trading Confusion
Many traders assume that leverage changes their average buy. It does not. Futures trades involve margin, not coins. The quantity inside futures is not part of your spot portfolio. Profit numbers inside a futures account do not change your spot average.
Mini DCA Movement Example
Picture three buys in a row.
- Month 1: 40000
- Month 2: 30000
- Month 3: 35000
The average buy settles between all three because of the weight of each purchase. It does not follow the most recent buy. It blends all three in one stable line.
Real Case Study Example
I once bought Dogecoin three times. One buy was at 0.10 dollars, another at 0.20, and the final at 0.30. I ended up holding 1000 coins. My total spend reached 200 dollars. This gave me an average buy of 0.20 dollars. When Dogecoin climbed to 0.50, I saw real gains. Later I checked fees and taxes and noticed a smaller net gain, but the average buy line gave me the correct target.
How to Calculate Your Average Buy Using CryptoCalculate
You can do this manually, but you can do it faster with the Crypto Profit Calculator on CryptoCalculate.net.
- Open the calculator from the menu.
- Enter every buy entry with price, quantity, and fees.
- Add the final total.
- Check the average buy field.
- Repeat the process when you add new coins.
You track several coins in seconds with the same method.
Common Mistakes You Should Avoid
- Leaving out the fees
- Combining buy and sell entries
- Recording only recent entries
- Mixing staking rewards with core buys
- Using different currencies without converting
- Adding futures numbers into spot cost
- Each of these mistakes weakens the accuracy of the blended number.
One small mistake many people make is treating reward tokens as part of their average. You should always track your cost base separately.
Some FAQs
Q1. Can the average buy price drop over time
Yes. If you buy more coins at a lower price, the new entry reduces your total average.
Q2. Should you include sells in the average buy formula
No. Sells do not change your average cost. You account for sells separately in your gain or loss.
Q3. Do staking rewards change your average buy
Your average buy stays tied to your purchases. Rewards may reduce your effective cost, but the formula does not change.
Q4. What if you buy in different currencies
You should convert each entry into one reference currency before calculating your average buy.
Q5. Is break even the same as average buy
No. Break even includes fees and related charges. Average buy reflects your direct cost.
Q6. Do wallet transfers change average buy
No. Transfers do not change cost because the coins remain the same.
Q7. Do deposits from another exchange affect your average buy
Only if the deposit carries a cost basis. If you bought the asset on another platform, you should carry that value into your new records.
Q8. Can a single buy entry move the average buy sharply
Yes. Large entries move the average significantly because they carry more financial weight.
Final Checklist Before You Track Your Portfolio
When you follow these steps, your average buy price becomes a steady guide through market volatility. It becomes easier to understand your position, your gains, your losses, and your next move.
- List each entry clearly
- Convert all amounts to one currency
- Include fees in the calculation
- Recalculate when new buys are added
- Keep rewards recorded separately
- Export your trade history
- Review your cost basis for reporting